KPIs are valuable resources to evaluate progress against measurable goals.
Microsoft Office SharePoint Server (MOSS) 2007 has built in features that allow you to manage and display KPI information in various different ways. KPI indicators can be derived from a SharePoint List, an Excel Workbook, data in SQL Server 2005 Analysis Services and manually entered information. For the purposes of this article, I will show you how to create a KPI list and manually populate it with data.
Lets create a Sales Analysis KPI list and see what results can be displayed. To get started, choose a site that is currently no in production use, such as a private sub-site.
1. Click on View All Site Content.
2. Click on Create.
3.On the Create page, click on KPI List.
4. Name the list Sales Analysis.
1. Providing a description is optional.
2.Choose whether or not you wish to have the list displayed on the left vertical navigation bar (QuickLaunch).
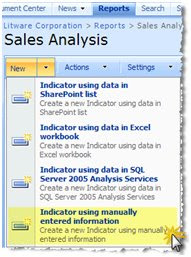
You now have an empty KPI list that is ready for you to add list items to. As I indivated above, we will be adding a few KPI items using manually entered information. From the New menu, choose Indicator using manually entered information; as shown in the figure below.

We are going to repeat this process 3 times; adding 3 indicators of the same type.
Indicator #1: Pipeline ($)
Set the name to Pipeline ($)
Set the indicator value to 330000
Set Better values are Higher
Set met or exceeded goal to 500000
Set met or exceeded warning to 300000
Indicator #2: Conversion Rate (%)
Set the name to Conversion Rate (%) Set the indicator value to 65
Set Better values are Higher
Set met or exceeded goal to 80
Set met or exceeded warning to 50
Indicator #3: Revenue ($)
Set the name to Revenue ($)
Set the indicator value to 250000
There are 2 built-in Web Parts that can be used to display your KPI data. The Key Performance Indicators Web Part will display all indicators in the KPI list. The KPI Details Web Part will display details of a single indicator in your list.
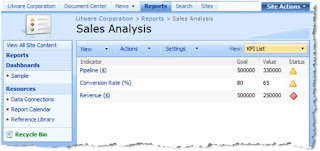
The Key Performance Indicators Web Part can display all indicators as seen in the figure below:

Set Better values are Higher
Set met or exceeded goal to 500000
Set met or exceeded warning to 300000
You should have a KPI list that now looks similar to the following figure:

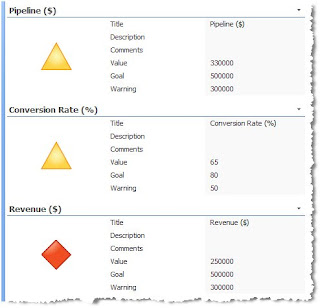
You can also separate each individual indicator out and display specific details. In the figure below I have added 3 KPI Detail Web Parts, each showing a single indicator.

@@@@@ For any clarifications and suggestions always wel come.
Cheers,
venkat